Blade Runner, one of the most acclaimed science fiction universes in the history of cinema, will be back very soon with its next installment: Blade Runner 2099. However, this time it will not be a movie, but a series produced by Amazon that will arrive directly on Prime Video to continue exploring Ridley Scott’s legacy. Now, after several delays due to actor strikes that pushed filming from 2023 to 2024, Prime Video has announced that filming has been completed, so the series could arrive sooner than we expect. With […]
Blade Runner, one of the most acclaimed science fiction universes in the history of cinema, will be back very soon with its next installment: Blade Runner 2099. However, this time it will not be a movie, but a series produced by Amazon that will arrive directly on Prime Video to continue exploring the legacy of Ridley Scott.
Subscribe to the Softonic newsletter and get the latest in tech, gaming, entertainment and deals right in your inbox.
Now, after several delays due to actor strikes that pushed filming from 2023 to 2024, it has been announced by Prime Video that it has been completed, so the series could arrive sooner than we expect. With 10 episodes planned, it is undoubtedly one of the most anticipated releases of the coming years.
Prime Video gives it all with its own Blade Runner
The series features an impressive cast led by Michelle Yeoh, who plays a replicant on the brink of her death. Joining her are Hunter Schafer, Dimitri Abold, Lewis Gribben, Katelyn Rose Downey, Tom Burke, Maurizio Lombardi, and Daniel Rigby. Ridley Scott, director of the original film, returns as executive producer, ensuring continuity in the visual and narrative style that made the saga iconic. Also participating are notable figures such as Silka Luisa (Shining Girls), who serves as showrunner and writer of several episodes, and Jeremy Podeswa (Game of Thrones), responsible for directing the first episode.
The premiere of the second season of Squid Game has caused all the fans of the Netflix series to go crazy again with the games starring Gi-hun. The new episodes have a tone more similar to a thriller full of secrets, and they are undoubtedly giving a very interesting twist to the original story. But does the series end here? Well, the truth is no. Netflix has already confirmed that in 2025, Squid Game will return with a third and final season. In this way, the cliffhanger left at the end of the second […]
The premiere of the second season of Squid Game has caused all the fans of the Netflix series to go crazy again with the games starring Gi-hun. The new episodes have a tone more similar to a thriller full of secrets, and they are undoubtedly giving a very interesting twist to the original story.
Subscribe to the Softonic newsletter and get the latest in tech, gaming, entertainment and deals right in your inbox.
But does the series end here? Well, the truth is no. Netflix has already confirmed that in 2025, Squid Game will return with a third and final season. In this way, the cliffhanger left at the end of the second season will finally be resolved, and fans will be able to have their expected conclusion.
The games will return one last time
“When I thought about the end of the third season, I felt that there was the closure,” explains creator Hwang Dong-hyuk, making it clear that it will be the last and definitive. “I believed that this story was enough to express everything I wanted to tell through Squid Game and from Gi-hun’s perspective as a character.” We still don’t know when this season will premiere, other than that it will be next year, but what is clear is that it will tie up all the loose ends that are still pending.
According to the latest leak that has reached the media, it is said that Apple’s next phone, the iPhone SE, will be priced under $500, which will completely separate the iPhone family between the iPhone 16 series, starting at $799, and the iPhone SE family. The arrival of the iPhone SE 4 also means that Apple is preparing to reduce its dependence on Qualcomm, as the affordable model is said to be the first to hit the market with the company’s internal 5G modem, codenamed Centauri.
According to the latest leak that has reached the media, it is said that Apple’s next phone, the iPhone SE, will have a price below 500 dollars, which will completely separate the iPhone family between the iPhone 16 series, starting at 799 dollars, and the iPhone SE family.
Subscribe to the Softonic newsletter and get the latest in tech, gaming, entertainment and deals right in your inbox.
By establishing its own telecommunications chip supply chain, Apple will no longer have to pay Qualcomm a considerable premium, which means it will have the flexibility to set a competitive price for the iPhone SE 4.
If the iPhone SE 4 launches for under $500, it could be a great budget-friendly option!
The price update comes from the blog of yeux1122 on Naver, where the informant mentions that the retail price of the iPhone SE 4 in Japan will be less than 500 dollars.
In terms of value, the figure is exceptional, and although it is more expensive than the launch price of $429 for the iPhone SE 3, customers are expected to experience a lot of changes, both internal and external.
For $499, customers should expect the internal components of the iPhone SE 4 to include an A18 SoC, 8 GB of RAM, a large 6.06-inch OLED display that will lack ProMotion support, but overall, the setup is very compelling.
The iPhone 16, which is available for $799 in the US, also comes with an A18 chipset and 8 GB of RAM, so seeing Apple going for the somewhat more affordable route should make its competitors very nervous.
Additionally, thanks to the enhanced neural engine of the A18 and the increased amount of RAM, the iPhone SE 4 will be Apple’s most affordable model with generative artificial intelligence features. The iPhone SE 4 is expected to be launched in the first quarter of 2025.
You don’t need to be an expert in sustainability to see how climate change is rapidly altering our daily lives. However, you also don’t need to be an expert ecologist to work in a more environmentally friendly way. Through Adobe Illustrator, we will explore practical and simple ideas that you can apply to your designs. From optimizing the use of colors to choosing formats that save resources when printing: creativity and commitment to the planet can go hand in hand, and here we will show you how. Reduced color palettes The colors of a project […]
You don’t need to be a sustainability expert to see how climate change is rapidly altering our daily lives. However, you also don’t need to be an expert ecologist to work in a more environmentally friendly way.
Through Adobe Illustrator, we will explore practical and simple ideas you can apply to your designs. From optimizing the use of colors to choosing formats that save resources when printing, creativity, and commitment to the planet can go hand in hand, and here we will show you how.
The colors of a project tell us everything: they serve to convey a message, transmit emotions, and much more. Having appropriate color palettes will help us streamline the work and be more concise with what we want to convey. Within Illustrator, we can create, save, and use custom palettes to ensure everything has the same visual line.
To access the palettes, we will need to go to Window > Swatches. Here, you can see a collection of basic colors already preset. If you click on the library symbol that you will see in the panel in the lower left corner, other thematic libraries will open.
If you want to create a custom palette manually, do the following:
Select the folder symbol to create a new group that contains all the colors you want. Name it and select OK.
Choose a color from the Color panel or with the eyedropper (I). Finally, click on the “+” button (New swatch) to save it in your group. Do it individually with the colors you want to group.
You can also use Adobe Colorto extract color palettes directly from an image. This online platform allows us to create completely customized color palettes.
Keep in mind that when working, you can make some more “eco-friendly” decisions, such as using solid colors. Effects and gradients require more ink and can also be more prone to printing errors. Reducing the color range and using lighter tones will make your projects consume less ink in the long run.
Save your projects in CMYK
If your work is intended to be printed, it is important to work in CMYK. This color model is the standard used in professional printing processes. If we work with it from the beginning, we will ensure that the colors are reproduced much more accurately.
While you can work in RGB and then convert it to CMYK, it is really not ideal as you will see how your projects lose details and consistency in the process. This is how we can prepare our documents for printing:
Go to File > Save As.. and select Adobe PDF.
In the Save Adobe PDF panel, choose a preset like PDF/x-4.
From Output, you will see in the PDF/X section that you are in Working CMYK.
Here, we can also include the bleed, which is something we will see better below. Finally, click on Save PDF to finish.
Optimize your projects and make the most of the paper area
Creating compact designs and organizing space on paper will help you make the most of the surface and use less material, saving costs. Additionally, correctly setting up printer marks and bleed areas will help you avoid additional cuts. Here’s how you can add printer marks in Illustrator:
Go to File > Print.
A new panel will appear where you must select the Marks and Bleed section.
Here, you need to select the type of bleed you want for your document. If you choose Trim Marks, specify the line width and the offset distance between the artwork and the boundary marks.
To add indentation, you will need to do the following:
Again, select File > Print.
Click again on the Marks and Bleed section.
In Bleeds, enter values for Top, Left, Bottom, and Right. This will specify the placement of the bleed marks.
If you want to use the predefined settings, click on Use Document Bleed. The maximum bleed you can set is 72.
To export the document with bleed lines, select File > Export As… and choose Adobe PDF. In the export options, select Marks and Bleeds and check the settings.
Make sure your designs reach the bleed edge. This will prevent white borders from appearing when trimming the print.
If you want to bring static images to life, After Effects is your best option. With After Effects, any user can create high-quality animations, effects, and transitions, even if they lack previous experience with this type of program. On the other hand, more experienced users can make even more use of it to make their projects more dynamic and attractive. In this article, we will take the first steps in After Effects so you can learn to animate any element from scratch. Create your project in After Effects Before starting, we will need to prepare a new project within After Effects. From the […]
If you want to bring static images to life After Effects is your best option. With After Effects, any user can create high-quality animations, effects, and transitions, even if they lack previous experience with this type of software. On the other hand, more experienced users can make even more use of it to make their projects more dynamic and attractive.
In this article, we will take the first steps in After Effects so that you learn to animate any element from scratch.
Before starting, we will need to prepare a new project within After Effects. From the home page, click on New Project and then New Composition. A new window, Composition Settings, will open, where we will need to write the project title and set its resolution, among other things. For this occasion, click on Preset and choose the HD option. If you want to try other resolutions, through Preset, you will see a long list of differentresolutions and sizes.
To open an existing project, go to File > Open Project. You can also import them from File > Import > File.
Animating in After Effects: Timeline and Keyframes
Within After Effects, we can create many types of animations and effects by changing their properties on the timeline. To do this, we need to work with Key Frames, which define the parameters of movement, effects, and audio. This way, the program knows how an object should change over time.
In the timeline, keyframes are represented as small diamonds, which you can move and adjust freely. To use them, you must do the following:
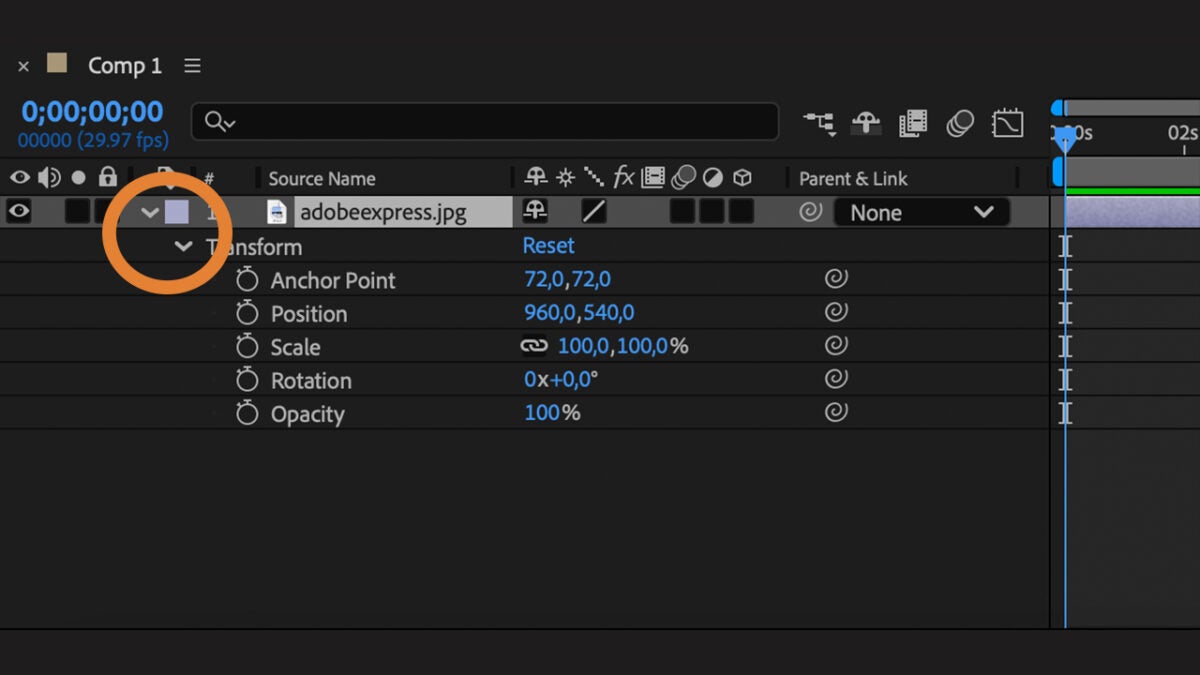
Select which layer you want to animate. It can be an image or text, for example.
In the selected layer, click on the arrow symbol on the left and select which section you want to animate. It can be the scale, position, opacity, etc.
From Position, you can control where the object is located on the screen. With Scale, you will control the size of the object. Rotation will help you rotate the object and Opacity to adjust its transparency.
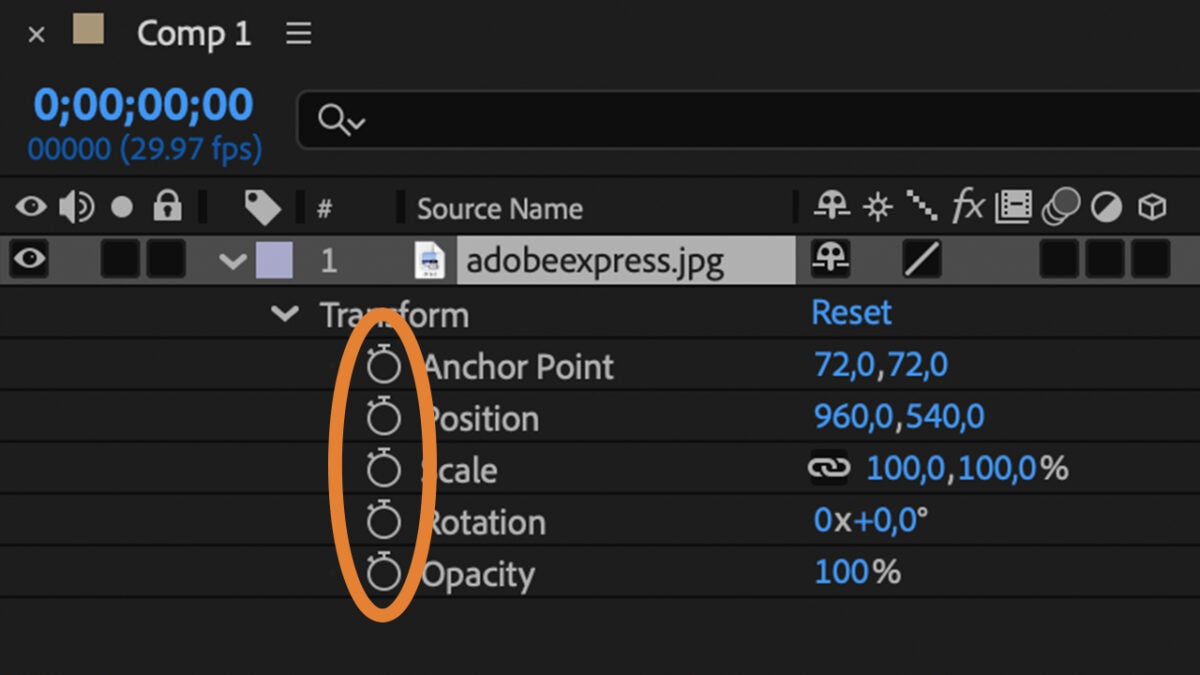
When you already know what to animate, activate the keyframe by clicking on the clock icon located to the left of the property.
With the keyframe, first, define where the animation starts. Move forward in the timeline and then add anotherkeyframe that is the end of that animation. You can press the spacebar to play it and see how the object in question changes between the two keyframes.
If you want the movement to look more natural, right-click on one of the keyframes and select Keyframe Assistant > Easy Ease Out or Easy Ease In. This makes the animation start or end more smoothly.
Add effects to your project
From After Effects, we can add all kinds of effects to our projects. To start, you just need to follow these steps:
Click on Window > Workspace > Effects & Presets. This will make a new panel of effects and presets appear on the right.
Use the search bar to find any effect. You have different categories: Audio, Color Correction, Distort, etc…
To add any of these effects, drag the effect from the Effects & Presets panel and place it on the layer where the item you want to animate is located.
When applied, the Effect Controls panel will appear. From there, you can adjust how the effect will look. Combine several effects to achieve more interesting results.
You can also animate the effect from the timeline. Locate the effect on the selected layer and click on the clock icon to add new keyframes.
If you want to orient your workspace towards effects, go to Window > Workspace > Effects. This will adjust the entire interface for effects editing. From Workspace, you can switch to other special layouts if you wish.
Export your animation
If you already have everything ready, export your animation by following these steps:
Go to the top menu and click on Composition > Add to Render Queue. This will open the render queue at the bottom of the screen and also allow you to adjust how you want to export your video.
Click on the blue text next to Output to to choose where you want to save your file and assign it a name.
Then, select the blue text next to Render Settings. From here you can adjust the quality, resolution, and frame rate.
Finally, click on the blue text of Output Module and select the format you need. The H.264 format is ideal for videos intended for social media. If the video has sound, make sure the Audio Output option is set to On.
From the Render Queue panel, click on the Render button to export your video. After Effects will start rendering and you can see the progress in real-time in the bottom panel.
Now that you have your project exported, all that’s left is to check that everything is correct and well. Experiment in After Effects with different effects, do tests, and be creative.
Amazon Prime launched two decades ago as a premium membership service offering free two-day delivery and returns in all Amazon purchases. However, this was only the beginning. Over the past few years this service has evolved, offering much more than saving us a few bucks ever so often. Now including video and music streaming, shopping, reading, healthcare and many other goodies, Amazon Prime is a must-have for anyone looking for a slew of benefits linked into a single Amazon account.
In today’s article we’re going to examine the latest Amazon Prime stats, growth, revenue and usage data, to better understand the past, present and future of this paid subscription service.
Subscribe to the Softonic newsletter and get the latest in tech, gaming, entertainment and deals right in your inbox.
Amazon reported $21.59 billion just from Prime subscription fees in Q1 2024.
How Many Amazon Prime Members Are There?
There’s currently over 200 million Prime members worldwide. If we look at the numbers gathered by Statista from 2015 to 2020, we can see how in five years the number of subscribers has experienced a 4x growth.
Here’s a detailed breakdown of the results:
2015- 46 million subscribers.
2016- 65 million subscribers.
2017- 100 million subscribers.
2018- 125 million subscribers.
2019- 150 million subscribers.
2020- 200 million subscribers.
How Many Amazon Prime Members Are in the US?
According to Consumer Intelligence Research Partners, Amazon Prime hit a new high of 184 million US subscribers in June 2024. eMarketer backs up this data, estimating that 180.1 million adults in the US use Amazon Prime as of 2024.
Here’s a detailed look on how Amazon Prime memberships have grown in the US:
2019- 126 million subscribers.
2020- 146.1 million subscribers.
2021- 161.7 million subscribers.
2022- 168.3 million subscribers.
2023- 174.9 million subscribers.
2024- 180.1 million subscribers.
How Many Countries Have Amazon Prime?
Currently, Amazon Prime is available in a total of 25 countries. Here’s a list of them:
Australia
Belgium
Brazil
Canada
Egypt
France
Germany
India
Italy
Japan
Luxembourg
Mexico
Malaysia
The Netherlands
Poland
Portugal
Saudi Arabia
Singapore
Spain
Sweden
The Philippines
Thailand
Turkey
United Kingdom
United States
Amazon Prime Revenue
It is estimated that by the end of 2024, Amazon’s Prime revenue will be over $40 billion.
In the Amazon’s Upfront 2024 event, Bezo’s company shared that Prime Video has an ad-supported reach of 200 million clients worldwide (including 115 million just in the US).
In a recent report made by eMarkerter, it is estimated that the number of Prime Video viewers in the US will reach 163.6 million by the end of 2024. To understand its magnitude, we only need to compare it to the 174 million viewers Netflix has in the US.
Here’s a breakdown of Amazon Prime Video users in selected countries:
United States- 163.6 million.
India- 65.9 million.
Germany- 32.3 million.
United Kingdom- 26.9 million.
Japan- 16.2 million.
Canada- 14.6 million.
France- 13.6 million.
Australia- 4.9 million.
How Much Do People Spend on Amazon Prime Day?
According to Adobe Analytics, people spent $14.2 billion during the 2024 Amazon Prime Day event, showing a growth of 11% year-over-year.
Here’s a detailed look on Prime Day spending since 2015:
Amazon Prime has evolved dramatically since its launch, from a simple way to have faster deliveries and save on shipping fees to a whole ecosystem of Amazon services and goodies. As the data shows, Amazon Prime memberships have grown at a stable rate during the past years and, if nothing changes, the tendency will remain the same. It all points out there’s a bright future ahead of Jeff Bezo’s empire.
iPhone and iPad games will never cease to amaze us. Among all the available categories, there is one that stands out especially for its ability to offer us complete stories and unleash mystery and creativity: graphic adventures. Over the years, these titles have evolved to adapt to touch screens, offering us increasingly immersive and complete titles. After discussing eight simulation games that look spectacular, today we gather eight great graphic adventures that we can enjoy on our iPhones. 1. Sky: Children of the Light Since its presentation, Sky: Children of the Light […]
iPhone and iPad games never cease to amaze us. Among all the available categories, there is one that stands out especially for its ability to offer us complete stories and unleash mystery and creativity: graphic adventures. Over the years, these titles have evolved to adapt to touch screens, offering us increasingly immersive and complete titles. After discussing eight simulation games that look spectacular, today we compile eight great graphic adventures that we can enjoy on our iPhones.
1. Sky: Children of the Light
Since its presentation, Sky: Children of the Light impressed us with its visual and narrative design. In this game, our mission is to recover the lost stars and return them to the firmament. All this while exploring seven realms full of secrets in the company of other players.
The title stands out for its cooperative approach —we can interact with other users to solve the different mysteries— and for the way its graphics seem to come to life. The different worlds are authentic works of art, making the experience even more immersive. The best part is that we can download it for free.
2. Oxenfree
If we are drawn to mysteries in the pure style of the 80s, Oxenfree is a fantastic choice. We accompany Alex and his stepbrother Jonas to an abandoned military island, where strange voices on the radio will guide us through an adventure full of unexpected twists.
The game makes us feel part of its unique atmosphere, with a script that hooks us from the first moment. Every decision we make affects the development of the story, making each game different. Oxenfree is available for free.
3. The Gardens Between
In this title, we join Arina and Frendt on a dreamlike journey through islands filled with puzzles and secrets. Here, our main task is to manipulate time to overcome obstacles and discover new routes to the top of each island.
What makes The Gardens Between exceptional is its ability to tell a complete story without the need for words. Its minimalist graphics and music complete an experience that combines the artistic with the challenging. Available for free.
4. Broken Age
This classic takes us to two parallel stories: that of Shay Volta, trapped in a ship controlled by an overly protective AI, and that of Vella, who seeks to escape the traditions of her village.
With hand-drawn 2D graphics and a very notable soundtrack, Broken Age offers us an experience that stands out for its emotive and well-structured narrative. It is one of those titles that we cannot miss. We can purchase it for 4.99 euros.
5. Day of the Tentacle: Remastered
The remastering of this classic allows us to relive one of the most beloved adventures of the genre. Facing a purple tentacle that wants to dominate the world, Day of the Tentacle offers us clever puzzles and humor that has stood the test of time.
The remastered edition includes enhanced graphics and updated sound effects, but also allows us to enjoy the original version — ideal for the most nostalgic experience. Available for 4.99 euros.
6. Whispers of a Machine
In this futuristic thriller, we play as Vera, a cyber detective investigating a murder that soon turns into a larger conspiracy. The game invites us to choose between being empathetic, analytical, or direct, which determines how the story progresses.
With a narrative that blends technology and moral dilemmas, Whispers of a Machine is ideal for when we seek a more introspective experience. Available for 3.99 euros.
7. Thimbleweed Park
This game takes us to a peculiar town where strange things happen. With a retro style reminiscent of the titles from the 80s, Thimbleweed Park combines humor, mystery, and curious cultural references in a very entertaining gameplay dynamic.
The cast of characters is as eccentric as it is endearing, and the dialogues, very witty, will make us smile more than once. We can purchase it for 9.99 euros.
8. Grim Fandango: Remastered
One of the great classics of the genre, now available for iOS. Grim Fandango: Remastered takes us to the underworld, where Manny Calavera, a travel agent, tries to solve a corruption case affecting souls in transit.
The game combines a frankly intriguing story with updated graphics and a simply masterful soundtrack. An essential piece for any graphic adventure lover. It is available for 14.99 euros.
If we enjoy games that make us think and explore, these graphic adventures stand out. Just like when we talked about 7 of the best mobile games for iOS and Android, now, from dreamlike landscapes to mysteries to unravel, each title on the list invites us to explore its world for hours. What better way to enjoy on our iPhone or iPad than with these interactive stories that leave us wanting more?
This year has been very interesting in terms of releases, and if we look back and see the 10 most anticipated movies of 2024, we are faced with many surprises, from the non-release of Frankenstein and Mickey 17 —which were delayed and are back on this list— to the absolute failure of Joker: Folie à Deux, which seemed to be the most anticipated of the year. It is clear, therefore, that cinema is a changing art and depends on many factors that are not only related to the genuine interest of the audience. Even so, […]
This year has been very interesting in terms of releases, and if we look back and see the 10 most anticipated movies of 2024, we are faced with many surprises, from the non-release of Frankenstein and Mickey 17 —which were delayed and are back on this list— to the absolute failure of Joker: Folie à Deux, which seemed to be the most anticipated of the year.
It is clear, therefore, that cinema is a changing art and depends on many factors that are not only related to the genuine interest of the audience. Even so, we leave you below with the 10 movies we are most looking forward to in 2025:
10 – Elio
Disney has many interesting releases this year, ranging from some that seem to have no favor with the public at all (ahem, Snow White, ahem) to others that will undoubtedly break the box office (The Fantastic Four: First Steps). However, after seeing that Inside Out 2 has been the highest-grossing movie of 2024, we must not overlook Elio, the next big Pixar film scheduled for June 13, 2025.
09 – 28 Years Later
I must say that, in recent months, I have been surprised by the public’s favor towards this franchise. While it’s clear that Cillian Murphy is a draw after winning the Oscar, the zombie saga seemed more than forgotten in obscurity… until 28 Years Later was announced. Scheduled for June 20, it might surprise as one of the blockbusters of the year.
08 – Frankenstein, by Guillermo del Toro
It has already appeared in the most anticipated of 2024 and it is still unclear if it will be released in 2025, but the film is already shot and promises to be a new leap in quality from the great Guillermo del Toro. Expectations couldn’t be higher after Robert Eggers’ Nosferatu, and Del Toro is always synonymous with cinematic pedigree.
07 – Mission: Impossible – The Final Reckoning
The eighth and (in principle) final installment of Tom Cruise as Ethan Hunt could only raise great expectations among the fans who have followed the agent over the years. Without a doubt, Cruise wants to end with a film that exceeds all expectations in terms of action, and that is always synonymous with a box office hit in every sense.
06 – The Fantastic Four: First Steps
After a few somewhat cursed years for Marvel Studios, they finally seem to have gotten back on track, and now they just need to close the Multiverse saga to be able to work calmly on regaining the favor of the public. The first step —pun intended— to achieve this will be this new remake of The Fantastic Four. Scheduled for July 25, it looks like a box office hit.
05 – Mickey 17
Now indeed, after being delayed from March 29, 2024, to April 18, 2025, Mickey 17 emerges asone of the most anticipated movies of the year. Directed by Bong Joon-ho (Parasite) and starring Robert Pattinson, it promises to be a fun and spectacular science fiction film.
04 – The Brutalist
It is one of the most repeated candidates for the Oscar Awards and premieres on January 24, 2025. Starring Adrien Brody and directed by Brady Corbert (Vox Lux, Mysterious Skin), it is a historical and epic drama that has all the ingredients to move both critics and audiences. We will see what happens.
03 – Wake Up Dead Man: A Knives Out Mystery
The third part of Knives Out is scheduled to be released sometime in 2025, and it is said that it will raise the stakes compared to the previous two. Without a doubt, Rian Johnson has become synonymous with undeniable quality, and the next adventure of detective Benoit Blanc seems to be up to the task.
02 – Avatar: Fire and Ash
If it doesn’t get delayed again—a very common dynamic in the Avatar franchise—on December 19, 2025, we will be able to see the third part of Avatar in theaters. This time, water gives way to fire and calm to the most catastrophic action. With James Cameron at the helm, it’s a safe bet. Will the audience respond as they did last time?
01 – Superman
A few days ago there might have been doubts about this movie, but now everything seems clear: Superman is destined to be the movie of 2025. The grand cinematic opening of the DC Comics universe by James Gunn arrives with lots of light, many gods, and many monsters. And its trailer shows that the audience wants everything from this new Superman.
Music streaming services have changed the way we listen to music. In the dawn of the digital-only era, physical music media such as CDs or vinyl discs are now more of a collectible item than a means to enjoy your favorite tunes.
Streaming services have also made the music industry evolve, relying now on these platforms to publish and distribute their music. In fact, 89% of the entire music revenue is made through streaming services, raising a staggering $17.5 billion every year. And this is just the beginning… How will music streaming platforms evolve through time?
In today’s article we’ll delve deep in the latest music streaming industry stats for 2025. From the size of the market and revenue to the most streamed songs, these are the most important music statistics you can’t miss.
Subscribe to the Softonic newsletter and get the latest in tech, gaming, entertainment and deals right in your inbox.
Music streaming makes up 89% of the music industry revenue.
The music streaming industry experienced a 10% growth over the last year.
The total revenue made globally by the music streaming industry is $17.5 billion.
Subscriptions and paid music makes up 23% of all music streaming.
78% of people listen to music via a streaming service.
Over 600 million people are subscribed to a music streaming platform.
Music Streaming Industry Revenue (2025)
Streaming services play a pivotal role in the music industry. As shown by a recent study made by Forbes, music streaming accounts for 89% of the total music industry. This overall growth is due an increase of 10.4% of the global revenues from streaming during the last year.
If we look at the numbers in detail, we can see how music streaming revenue has surpassed $19 annually. This revenue has been increasing year-over-year since the mid-2000s, with an incredible growth of 34x from 2010 to 2020.
Here’s a detailed look on how much the annual music revenue has grown since 2005:
Music streaming services have become the cornerstone of the music industry’s financial model. According to the data gathered by IFI’s Global Music Report 2024, more than half of the music listened worldwide comes from streaming. This whooping number can be divided with 23% of the global music consumption coming from paid music streaming, 22% from video streaming and 9% from ad-supported music streaming.
Here are the most popular ways to listen to music:
Paid music streaming- 23%
Video streaming- 22%
Radio- 16%
Short videos (TikToks)- 11%
Ad-supported music streaming- 9%
Purchased music (CDs, downloads)- 9%
Other (Netflix, music borrowing)- 5%
Social media- 3%
Live shows- 2%
Globally, music streaming platforms make up89% of the worldwide music industry revenue. If we look in detail, in countries like the United States the usage of music streaming services is even bigger. In fact, 84% of the US music industry revenue comes in fact from music streaming platforms, while physical sales amass only 11%.
Music streaming growth is not likely to change anytime soon. Data gathered by Statista forecast that the music streaming popularity will increase in the coming years, surpassing the $30 billion in 2027.
Here’s a detailed breakdown of the results:
2019- $25.48 billion.
2020- $27.87 billion.
2021- $28.12 billion.
2022- $28.02 billion.
2023- $28.12 billion.
2024- $29.99 billion.
2025*- $30.14 billion.
2026*- $30.24 billion.
2027*- $30.33 billion.
(*estimated)
Music Streaming User Stats
According to the Global Music Report 2024, 67.3% of people use some form of music streaming service. That’s 2 in every 3 people worldwide. It’s important to point out how the popularity of streaming platforms has boomed in the past decade. If we look at the data gathered by IFPI and MIDiA Research, we can conclude that the number of music streaming platform subscribers has gone up by 10x.
Here’s a detailed look on how the number of subscribers have been steadily increasing since 2015:
Q4 2015- 68 million.
Q4 2016- 100.4 million.
Q4 2017- 198.6 million.
Q1 2018- 229.5 million.
Q1 2019- 304.9 million.
Q4 2019- 341 million.
Q1 2020- 400 million.
Q4 2020- 443 million.
Q1 2021- 487 million.
Q2 2021- 523.9 million.
Q2 2022- 616.2 million.
Music streaming has actually become so popular that according to market monitor Luminate, the global on-demand audio streams reached the 4 trillion mark for the first time ever in 2023. But that’s not all, the use of premium streaming services has also increased during the past years. Only in the US there’s 96.8 million premium subscribers, 51% more than there were in 2019.
Here are the latest numbers for US premium subscribers:
2019- 60.4 million.
2020- 75.5 million.
2021- 84 million.
2022- 91.6 million.
2023- 96.8 million.
Music Streaming Demographics
Paid music streaming platforms have become part of our daily lives, especially among younger generations. Currently, 62% of all 25 to 34-year-olds are using audio subscription services to listen to music. On the other end of the spectrum we find the eldest generation, with 1 in every 4 55 to 64-years-old having one as well.
Here are the figures gathered by IFPI’s survey:
What Generation Streams the Most Music?
Different generations make use of music streaming in a different way. If we look in detail at the American market, we find out that almost all Gen Z living in the US use a music streaming service. However, the difference isn’t very pronounced across all age brackets, with over 90% of Americans using these services disregarding their age.
In other countries, the difference between generations is more pronounced. Here’s a detailed list of the music streaming habits of different nations, divided by generations:
Brazil: Gen Z (87%) Millennials (89%) Gen X (73%) Boomers (63%).
Mexico: Gen Z (83%) Millennials (87%) Gen X (81%) Boomers (75%).
Colombia: Gen Z (84%) Millennials (88%) Gen X (76%) Boomers 69%).
Argentina: Gen Z (87%) Millennials (89%) Gen X (77%) Boomers (58%).
Chile: Gen Z (91%) Millennials (92%) Gen X (78%) Boomers (72%).
France: Gen Z (84%) Millennials (68%) Gen X (53%) Boomers (37%).
Spain: Gen Z (82%) Millennials (78%) Gen X (74%) Boomers (57%).
UK: Gen Z (77%) Millennials (79%) Gen X (67%) Boomers (41%).
Italy: Gen Z (77%) Millennials (76%) Gen X (59%) Boomers (40%).
Germany: Gen Z (83%) Millennials (78%) Gen X (59%) Boomers (37%).
Japan: Gen Z (89%) Millennials (70%) Gen X (51%) Boomers (34%).
US: Gen Z (99%) Millennials (98%) Gen X (96%) Boomers (89%).
What Nation Has More Paid Music Subscriptions?
A recent report made by IFPI shows how Sweden is the nation with the most paid music subscriptions. In fact, 61% of the population has one or more paid subscriptions to music streaming platforms.
Here’s a complete breakdown of the results:
Sweden: 61%
Mexico: 57%
Germany: 55%
US: 53%
New Zealand: 52%
How Much Time Do People Spend Listening to Music?
According to IFPI’s Engaging With Music report, we’re listening to music in more ways than ever. On average, we spend 20.7 hours per week listening to music, 2.89% more than we did the previous year. That’s the equivalent to 13 additional 3 minute songs every week.
This level of commitment to streaming music has also grown by one hour and 42 minutes since 2021. This increase in streaming time reflects how music streaming has become part of our daily routines and lifestyles.
Here’s a detailed look of the music streaming industry market share:
Spotify: 31.7%
Tencent Music: 14.4%
Apple Music: 12.6%
Amazon Music: 11.1%
YouTube Music: 9.7%
NetEase: 6.7%
Yandex: 3.4%
Deezer: 1.3%
Others: 9.7%
Spotify Stats (2025)
With over 615 million monthly active users, Spotify is the most popular music streaming platform worldwide. From these, approximately 252 million are subscribed to Spotify Premium, the platform’s paid streaming service. If we compare it to previous data, we can see how Spotify’s subscriber base has increased dramatically in the last few years, more than doubling the numbers since early 2019.
Here’s a detailed look of the results:
Q1 2015- 18 million.
Q2 2015- 22 million.
Q3 2015- 24 million.
Q4 2015- 28 million.
Q1 2016- 30 million.
Q2 2016- 36 million.
Q3 2016- 40 million.
Q4 2016- 48 million
Q1 2017- 52 million.
Q2 2017- 59 million.
Q3 2017- 62 million.
Q4 2017- 71 million.
Q1 2018- 75 million.
Q2 2018- 83 million.
Q3 2018- 87 million.
Q4 2018- 96 million.
Q1 2019- 100 million.
Q2 2019- 108 million.
Q3 2019- 113 million´.
Q4 2019- 124 million.
Q1 2020- 130 million.
Q2 2020- 138 million.
Q3 2020- 144 million.
Q4 2020- 155 million.
Q1 2021- 158 million.
Q2 2021- 165 million.
Q3 2021- 172 million.
Q4 2021- 180 million.
Q1 2022- 182 million.
Q2 2022- 188 million.
Q3 2022- 195 million.
Q4 2022- 205 million.
Q1 2023- 210 million.
Q2 2023- 220 million.
Q3 2023- 226 million.
Q4 2023- 236 million.
Q1 2024- 239 million.
Q2 2024- 246 million.
Q3 2024- 252 million.
Spotify Vs Apple Music Stats
Spotify currently has more than double of Apple Music’s subscribers, being the most popular music streaming platform in the world. Apple Music, while being once the leader in digital music, is behind Spotify in overall users.
Here’s a detailed comparison between both music platforms regarding its number of subscribers:
2016- Spotify (36 million) Apple Music (20 million).
2017- Spotify (59 million) Apple Music (27 million).
2018- Spotify (83 million) Apple Music (40 million).
2019- Spotify (108 million) Apple Music (50 million).
2020- Spotify (136 million) Apple Music (72 million).
2021- Spotify (165 million) Apple Music (80 million).
2022- Spotify (188 million) Apple Music (88 million).
2023- Spotify (220 million) Apple Music (93 million).
2024- Spotify (252 million) Apple Music (101 million).
What is the Most-Streamed Song Ever?
As of December 2024 and with over 4.6 billion streams, Blinding Lights by The Weeknd is the most-streamed song in streaming platforms. In second position and with 4.1 billion streams we find Ed Sheeran’s Shape of You. Closing the top 3 we have Lewis Capaldi’s Someone You Loved with 3.73 billion streams.
Here’s the Top 10 most-streamed songs of all time:
Blinding Lights (The Weeknd)- 4.62 billion streams.
Shape of You (Ed Sheeran)- 4.16 billion streams.
Someone You Loved (Lewis Capaldi)- 3.73 billion streams.
As It Was (Harry Styles)- 3.69 billion streams.
Starboy (The Weeknd)- 3.65 billion streams.
Sunflower (Post Malone)- 3.65 billion streams.
One Dance (Drake)- 3.47 billion streams.
Sweater Weather (The Neighbourhood)- 3.45 billion streams.
Music streaming is growing and evolving at an unprecedented rate, becoming an essential part of our everyday lives. With the music industry being reliant on these digital platforms and thousands of new songs added every day to their libraries, this fast-paced world of streaming has a bright future ahead of itself.
This upcoming 2025 is going to be quite intense, especially for those of us who love going to the movies and enjoying a good action film with popcorn and the full experience. For that reason, we have decided to look a few months ahead and bring you the best releases of the year. The list is made up of the six movies that we consider the most anticipated of 2025, keeping in mind that we are talking about action movies, although within this genre it is possible that a horror movie might make it onto the list (you know by […]
This upcoming year is going to be quite intense for those of us who love going to the movies and enjoying a good action film with popcorn and the full experience. Here’s a look at the few months ahead and what the best releases of the year will be.
The list is made up of the six movies that we consider the most anticipated of all 2025, considering that we are talking about action movies, although within this genre it is possible that a horror movie might make it onto the list (you surely know where this is going).
The cinema in 2025 will not be a strange place for all of us here reading this article, we can assure you! 12 months full of powerful premieres and highly anticipated movies are coming. Let’s review!
Mission: Impossible – The Final Reckoning (May 23, 2025)
Tom Cruise returns for the last time in the upcoming Mission: Impossible — The Final Reckoning, which marks the end of Ethan Hunt’s journey in his most dangerous mission to date.
As the fascinating teaser trailer shows, the action scenes have the potential to continue pushing the boundaries of what’s possible. With Cruise (of course) performing his own stunts once again, The Final Reckoning is expected to be an epic conclusion to the Mission: Impossible franchise. We are not ready to say goodbye to Ethan. I’m not.
Ballerina (June 6, 2025)
Ballerina is the new and exciting spin-off of the John Wick franchise, following a young assassin seeking revenge for her family’s death. Ana de Armas will shine in the lead role and, as John Wick fans know, the world of highly skilled assassins offers endless possibilities for intense action.
Ballerina will premier on June 6 of this year. With promises of expanding the universe of its predecessor, Ballerina offers the perspective of a new and entertaining protagonist after so much Keanu Reeves (he deserves a break).
28 Years Later (June 20, 2025)
28 Years Later, by Danny Boyle, one of the most anticipated horror movies coming in 2025, will return to the post-apocalyptic world of the well-known universe of 28 Days Later.
The sequel will pick up the aftermath of the rage virus, this time focusing on the new survivors navigating the wasteland and offering an exciting continuation of the franchise. The aim is to delve into the consequences of living in an apocalyptic world and fans can expect returning characters and new faces, all exploring the harsh reality of surviving in a chaotic world. Can it be June 20th already?
The Jurassic Park franchise is also set to return with Jurassic World: Rebirth. This chapter will explore additional territories within the familiar realm of dinosaurs, bringing back known characters and introducing new faces (including Scarlett Johansson).
The film will delve into the consequences of coexistence between humans and dinosaurs, with the return of Colin Trevorrow as director. Jurassic World: The Rebirth promises more thrilling action and tense dinosaur chases for a summer blockbuster in 2025.
Under the direction of James Gunn, an exciting reboot of Superman is being prepared that will bring a new perspective to the iconic superhero. Following Henry Cavill’s departure, David Corenswet will don the cape and tights.
Corenswet promises to reinvigorate the character for a new generation and has a great responsibility. Superman will begin a new chapter in the DC Universe, focusing on Clark Kent’s early days as a hero in Metropolis. This new 2025 version of a classic hero is expected to present a more grounded and nuanced Man of Steel. It is a key year for Warner and its superheroes.
Avatar: Fire and Ash (December 19, 2025)
Avatar: Fire and Ash, by James Cameron, will continue the epic saga of Pandora. Picking up the story of Avatar: The Way of Water, this third installment of the Avatar series will dive even deeper into the planet’s ecosystems and the ongoing conflict between the Na’vi and the human invaders, pushing the boundaries of visual storytelling with innovative special effects and astonishing world-building.
Fans can expect more impressive visual effects along with a classic portrayal of the environmental themes that define the first movie. This continuation of the saga promises to be an epic journey for both fans of the franchise and newcomers. Will it surprise the audience for the third time?